

This approach brings many benefits to the software development lifecycle, ushering in new methodologies, new tools, and new testing standards and best practices.
To continue this collaboration, TestMonitor polled the software development community to learn how they approach user acceptance testing (UAT), understand common hurdles throughout the quality assurance (QA) process, and collect best practices to share with others.
The following is a summary of the results from the survey and the best practices and takeaways that respondents wanted to share.


In fall 2021, TestMonitor polled professionals from across the software testing field, including test and QA managers, IT project managers, engineers, and developers.
There were more than 40 respondents from a range of industries, including retail, healthcare, entertainment, financial services, and telecommunications. They all share the common task of developing software for customers inside and outside their organization.
Here is the breakdown of respondents by industry:

Respondents represent organizations from around the world, including:
- 68 percent from Europe
- 19 percent from North America
- 4 percent from Asia
- 4 percent from South America
- 2 percent from Africa
Respondents are also responsible for testing across different types of software:
- 51 percent test mobile applications
- 64 percent test enterprise applications
- 74 percent test web-based applications
When asked what drives the respondent’s organization to pursue UAT, 70 percent noted that testing is used to build the best product for their audience. About 15 percent use testing to collect end-user feedback and ensure compliance.

Functional Testing
Despite the growing awareness of automated testing, survey respondents still use manual testing when evaluating their software’s performance against functional tests.
In fact, 96 percent of respondents use manual testing to run functional tests. Just under half (49 percent) use automated testing to aid their functional tests.
Non-Functional Testing
For non-functional testing, 45 percent of respondents manually run scripts for usability, load, and security tests, whereas 28 percent run these tests with automated testing tools.
The Frequency of UAT
Interestingly, there was wide variability in the frequency with which respondents perform UAT during their projects or cycles.
UAT is not just one single thing. It is a set of tools that encompass several steps and benchmarks.
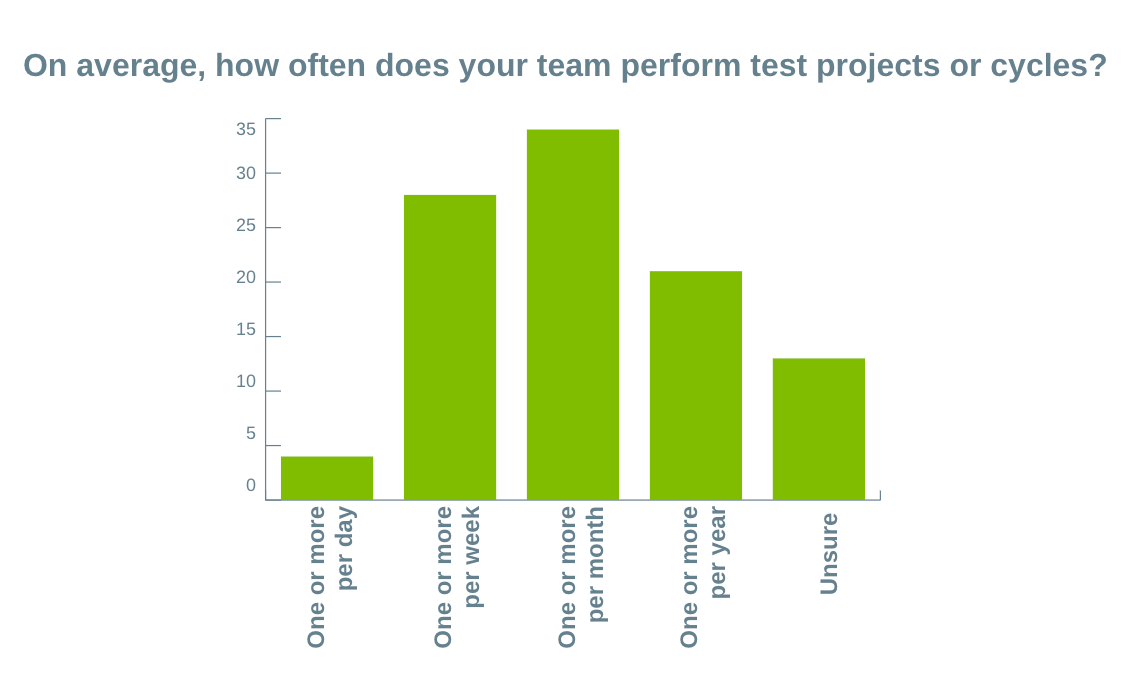
Notably, of those surveyed, 66 percent perform UAT at least once a month.
The Tools That Enable UAT
Respondents also demonstrated that there is still wide variability in how organizations use software to enable UAT.
In particular, 43 percent of respondents use specialized test management tools, such as testing and automation applications, whereas 23 percent lean solely on other generic tools, such as word processing and spreadsheet software. About 30 percent of respondents noted that their team uses both types of software to facilitate UAT.
The Most Time-Consuming Aspect of UAT
When it comes to the mechanics of running UAT, respondents showed that each phase of the testing process comes with challenges.
In particular, 36 percent of respondents stated that running tests is the most time-consuming aspect of their quality assurance process, followed by designing test cases and planning out test runs, respectively.

About 13 percent of respondents noted that analyzing test results and performing reporting activities are their most time-consuming activities.

The involvement of end users is a big part of UAT, but the frequency with which respondents do so varies.
When asked how they involve end users in their UAT efforts, there was a wide range of responses:
- 40% always involve end users
- 15% regularly involve end users
- 26% occasionally involve end users
- 19% never involve end users
Of those that involve end users in their UAT, 75 percent involve less than 10 end users, 19 percent involve between 11-25 end users, and 6 percent include more than 25.

The Most Challenging Aspect of UAT
Respondents shared which aspect of UAT is the most challenging for their team, and two-thirds said it is the test design and planning phases. Actually running the tests is the biggest challenge for 15 percent of the respondents, and 19 percent noted that analyzing the test results is their biggest hurdle.
The Quality of UAT
Despite the challenges in both involving end users and designing and running UAT, most respondents still believe that the overall quality of their approach is effective.
Of those surveyed, about 48 percent rated the quality of their current UAT a seven or above, with 10 being very satisfied. About 38 percent said they are moderately satisfied, and 11 percent claimed to be very dissatisfied.

In addition to sharing their approach to UAT, challenges, and overall satisfaction with testing results, the respondents were also asked to share best practices.
The feedback focused on three main themes:
Enabling End-User Testers
Several respondents noted that it is important to “make it as easy as possible for end users” to participate in testing. They also advocated for involving them from the beginning of the quality assurance phase.
Others noted the value of preparing as much of the logistics for testing as possible, especially if some would be done remotely. This includes how results will be captured, how updates will be communicated across teams, and what support will be available to testers while they work.
Keeping UAT Simple and Focused
Many respondents emphasized creating “clear and well-defined acceptance criteria” and making “test cases as approachable as possible” for end-user testers.
Others emphasized creating “detailed test cases” and plans, prioritizing them, and communicating objectives or goals with testers.
Planning for Bug Tracking and Triage
Many respondents noted the need to have processes and methods for capturing issues and bugs found during testing. This includes how bugs will be triaged and prioritized for remediation.

Although UAT can be stressful, having the right approach can make the experience fruitful and meaningful for your project team.
With an industry-leading test management tool designed to streamline the administrative aspects of testing and facilitate test case design, storage, and sequencing, your team can focus less on the mechanics of testing and more on driving impact for your customers.
Ultimately, whether your team conducts one test run or many per project, the results provide the validation, feedback, and guidance they need to take your software development over the finish line.
We hope you use these results to better understand trends across the larger community and improve your internal testing approach.
